Decoding Bitcoin's 'Bart Simpson' Pattern: Are Markets Braced for a Flash Crash?
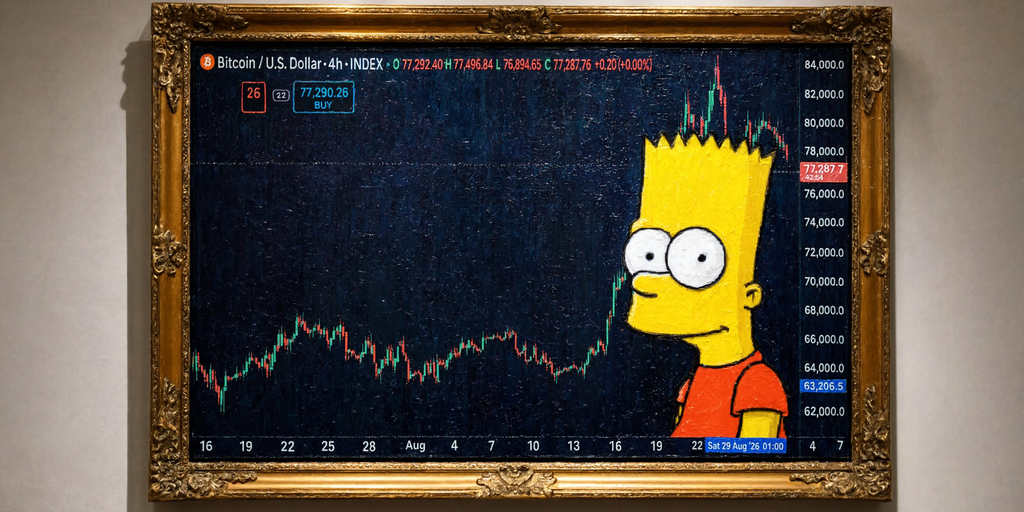
As Bitcoin retraces from its August highs, technical analysts are examining whether a classic 'Bart Simpson' pattern signals a severe correction or mere consolidation.
Source image: decrypt.co
decrypt.coAnatomy of the Chart Formation
The cryptocurrency market has once again found itself fixated on a familiar yet dreaded technical anomaly: the Bart Simpson pattern. Named after the spiky-haired cartoon character, this formation is mapped out across three distinct phases on lower time-frame charts. It begins with an aggressive vertical price spike, transitions into a flat, low-volume horizontal consolidation range that forms the head, and typically concludes with a sharp snap-back reversal that wipes out late-arriving momentum traders.
In late August, Bitcoin experienced a powerful surge, climbing roughly 25% from a local base near $64,420 to approach the $80,700 threshold. However, subsequent sessions have seen the asset bleed back down toward the mid-$77,000 range. This spike-and-fade price action has resurrected discussions across trading desks regarding whether the current market structure mirrors previous historical setups that preceded severe corrections.
Under the Hood: Spot Demand vs. Derivatives
A closer look at market fundamentals reveals a divergence between spot and derivative markets. Over consecutive sessions following the late-August peak, spot demand turned net negative, signaling that organic buyers are stepping back. Conversely, futures demand has remained relatively resilient, maintaining open interest even as prices drifted lower.
Compounding this dynamic is a notable uptick in long-term holder distribution. On-chain metrics indicate that seasoned wallets increased their profit-taking activity significantly between August 18 and August 28, offloading hundreds of thousands of BTC into the market. This surge in available supply during a period of slowing momentum explains why the asset has struggled to sustain its upward trajectory.
Key Technical Levels to Monitor
While the visual silhouette of the chart has alarmed retail participants, professional analysts urge caution against premature panic. Technical indicators on the four-hour chart currently present a mixed picture rather than a definitive breakdown signal:
- Relative Strength Index (RSI): Hovering in the mid-40s, indicating a mild bearish bias without entering oversold territory.
- Average Directional Index (ADX): Sitting below the key 25 threshold, signifying a lack of a strong overarching trend in either direction.
- Critical Support Zone: Market analysts have pinned $75,800 as the line in the sand. A decisive break below this threshold would validate the bearish pattern completion, whereas a hold could pave the way for a retest of higher resistance levels.
Market Implications and What Investors Should Watch
The appearance of a Bart pattern often serves as a psychological stress test for leveraged traders, frequently resulting in cascading liquidations rather than systematic macro crashes. For institutional investors and high-net-worth market participants, the current environment demands heightened vigilance regarding macroeconomic data releases, including upcoming inflation prints and labor reports that will heavily influence Federal Reserve policy decisions.
As September unfolds, market participants should watch order book depth around key psychological levels and monitor whether spot accumulation resumes. While the cartoonish moniker suggests impending doom, differentiating between routine post-rally consolidation and genuine structural breakdown remains vital for effective risk management.
Continue reading
Related coverage in Crypto
cointelegraph.com
Trump Schedules Third Memecoin Holder Dinner Amid Growing Corruption Scrutiny
President Trump is set to host his third exclusive memecoin dinner for top token holders at his Washington, DC golf club, drawing renewed ethical and market scrutiny.
3 min read
cointelegraph.com
50,000 Europeans Petition EU to Relax MiCA Stablecoin Reward Restrictions
A new 50,000-letter campaign is urging Brussels to ease stablecoin rewards restrictions during the MiCA review, aligning with broader central bank pushes.
2 min read
cryptonews.com
Dogecoin Eyes $1 Milestone as DogeOS Testnet Launch Sparks Utility Speculation
Dogecoin trades at $0.09447 as the DogeOS testnet goes live. Traders eye the $0.098 resistance and psychological $0.10 mark amid fresh utility potential.
2 min read
decrypt.co
Bitcoin Enters 'Uptober' Amid Fed Rate Hike Pressures and 5.3% Treasury Yields
Bitcoin enters its historically strongest month following a record September, yet rising Federal Reserve rate hike fears and 5.3% Treasury yields present major hurdles.
2 min read